dzieki kresce po dolkach 1 i 2 mozemy okreslic mozliwosc wystapienia szczytu 2
13:00 1,31874
Dodano po 8 minutach:
oczywiscie cały czas pamietamy o niezrealizowanym SHS na H1, i o tym, ze nieco wypadlismy z trendu i mozemy tam nie wrócić


a wiesz czy tam dotrze w ogole??Little Scalper pisze:której ? bo masz ich tam bardzo wiele a i tak wszystkie wskazują miejsce w ktorym po prostu poprzednie wsparcie zamienia się w opór ( poziom LL zmienia się w LH ). Po co tak to komplikować. Dla mnie tyle kresek odwraca uwagę od tego co najważniejsze.zeuss pisze:dzieki kresce


zeuss pisze:a kto to jest Boga, nie znam tego analityka?
zeuss pisze:zielona kreska jest boską kreską

Jeśli próba statystyczna byłaby odpowiednia duża, to byś stracił prawie (+/-) dokładnie tyle, ile by Cię kosztowało pozajmowanie tych pozycji.Little Scalper pisze:Zarobił bym czy stracił ?

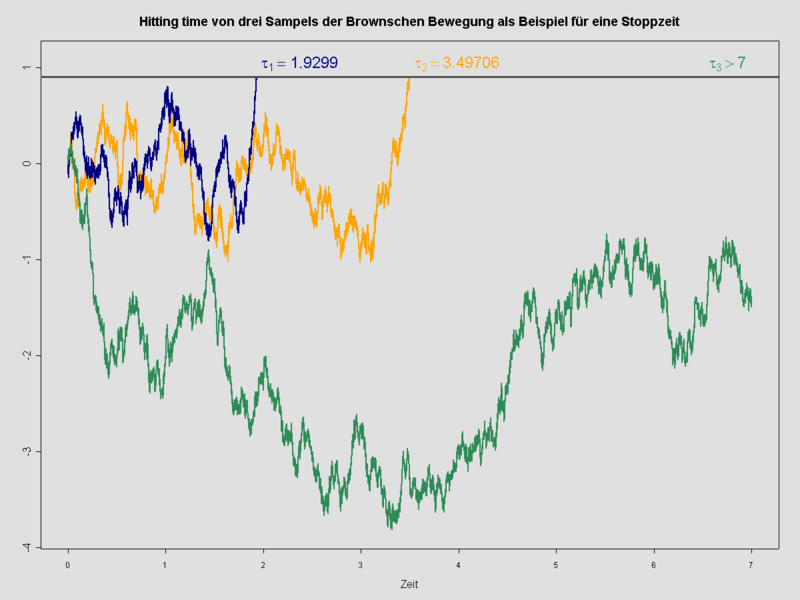
Czytałem kiedyś o tym. Ci co się znają na informatyce/programowaniu udowodnili że wykresy rysowane losowo przez komputer to fikcja.daromanchester pisze:Indeks Random 25https://merlin2.betonmarkets.com/d/trad ... ymbol=R_25The random walk is a stock index whose price is simulated using random numbers. Unlike real market stock indices whose prices depend on the prices of the individual stocks listed on the Exchange, the random stock index only relies on factors like volatility, previous index price (previous simulated price) and a random number to determine the price of the index. Due to the use of random numbers, the price (or direction) of the index cannot be predicted with certainty and thus behaves like a real market index. When the index is appended with a number, the number is the percentage volatility which would be used in the calculation of the index price. For instance, for the Random Index 25 we use a volatility of 25% in the calculation of the index price. The index started at 1000 on 16-May-2004.
Kto się podejmie zrobienie AT?