
Wkopiuje tutaj taki systemik (podobno niezły - jeszcze nie sprawdzałem) bo się od czasu do czasu pojawia w sieci i nagle znika. Także na wszelki wypadek go tutaj zamontuje. Może się komuś nawet przyda. System nazywa się Hilda Baker i dosyć głośno o nim ostatnio.
The Broom-Hilda Forex Trading System
‘CleanSweep' High Impact Low Drawdown Analysis
Important Disclaimer: Forex. Futures. Options and Securities trading have risk of loss and may not be suitable for all persons. No system can guarantee profits or freedom from loss. Past results are not necessarily indicative of future results. Hypothetical or published performance results have certain inherent limitations dependent upon the trader using the system. No representation is being made that any account will or is likely to achieve profits or losses similar to those shown. In any case, no-one will be responsible or liable for ANY SPECIAL. INCIDENTAL. CONSEQUENTIAL. INDIRECT OR ANY OTHER LOSSES caused by using of Broom-Hilda Forex system.
Welcome to B.R.O.O.M.H.I.L.D.A.
The Broom-Hilda Forex Trading System has the ability to turn around your trading fortunes.
I am so confident in this now free system, you will see that if you follow the system it will reap dividends.
The system comes with the following items
• Three Metatrader custom indicators
• A chart Template
• The hope someone will create a Paltalk room for all Broom-Hilda users
This first section relates to the setup of the Broom-Hilda charts and systems and details everything you will need to do.
1) Download and install the Metatrader 4 trading platform.
You can download the trading platform from this site http://www.metaquotes.net/
The trading platform operates on a demo basis that you will need to renew every 30 days - don't worry, its easy to do and this keeps this superior trading platform totally free of charge. When you install the platform it will ask for your details to open a demo account — this doesn't cost you anything and the figure you see of $5000 is just the amount of money it places in your demo account.
When you have installed Metatrader spend a few days getting used to the platform. Pay attention how to place indicators on the chart, how to open and close charts, how to place demo trades (if you want to test Broom-Hilda for a while) and how to apply a template to a chart as well as how to save them.
Learn to arrange the charts so you can have multiple time frames showing etc etc - lots to learn with this one!
These few days will pay you dividends in the future.
2) Install the Broom-Hilda system indicators
Do you think we want to ream you for GBP2300.00? No way, grab this zip file as an expression of our appreciation. It's free so enjoy.
To unzip the indicators in the file you will need unzipping software. If you don't have any then download WinZip from http://www.winzip.com. Go for the evaluation version which is free and unrestricted.
So, in the zip file you will see the following files:
BROOM-HILDA.ex4
SuperWoodieCCI.mq4
ColorOsMA.mq4
BROOM-HILDA.tpl
Note that the BROOM-HILDA.ex4 is the only file that is protected but certainly doesn't have any ****** time expiry rubbish in it. In fact, you could even use the popular J_TPO.mq4 indicator with a setting of 10 and it will do the exact same job. Go on, try it and see
Now you have to extract the files to the following folders - it's very important that they go in the right place as follows:
BROOM-HILDA.ex4
SuperWoodieCCI.mq4
ColorOsMA.mq4
The first three go into you c:\program files\metatrader 4\experts\indicators (providing you allowed the program to name the folder 'Metatrader 4' if you didn't and you chose a different name then use that one)
BROOM-HILDA.tpl
The last indicator goes into your c:\program files\metatrader 4\templates folder
That's it - the indicators are now installed
3) Building the chart
Now, if Metatrader is still open you need to close and restart it.
Try not to have too many charts open - the Broom-Hilda indicator can be memory hungry but not as hungry as a more expensive $US4000 system who have **** programmers doing their rip-off renamed indicators.
All you should have to do now is right click on one of the charts, choose 'template' and a list will appear. In that list you will see 'BROOM-HILDA' - click on that and it 'should' set up the chart for you.
Do this on both charts and set one to 5 min and one to 15 min - this is by far the usual timeframe that Broom-Hilda trades.
If you're looking for longer trades then go for the following combinations:
1 and 5 min - scalps
5 and 15 - usual intraday - this is the best timeframes to trade
5 and 30 - extended intraday
15 and 60 - long one and two day trades
30 and 240 - swing trades
60 and 240 - swing trades
240 and daily - position trades
Daily and weekly - long position trades (for going on holidays with)
When taught the system properly you will take all timeframes into account - however you will never have more than 2 charts open at once - learn to change the timeframe with the menu buttons and you can happily flick through timeframes as you wish.
Its also psychologically important that you only view two charts - the more charts and timeframes you have open the more reasons you will find NOT to trade - simple solution is don't do it.
You will also see many people trading in the chat rooms that say - look cable is rising so I'm going long euro - I have to be blunt here - if you're not an expert on correlations this is total ****. I do know one person that plays correlations but the rule is if you are hading euro then don't look at cable or swissy cos the only thing they have in common is the dollar - the correlation people are ignoring half of the economy associated with that pair. Enough said!
Trading Broom-Hilda
Ok. Time for business. Let's teach you how this baby flies.
This part of the document is only to give you an overview of the system. As you read through you should be writing down questions you have – someone will get a Paltalk channel going and you can soon ask in there. Any takers on someone setting up this Paltalk channel ??
System Overview:
The Broom-Hilda system is a trend following system like many. Where it's different is that you are not limited to a single timeframe or a single currency pair.
It's important that you get out of your head that you are a single timeframe trader. Many traders will trade only the 5 min charts or only the 30 min charts. You are going to be different.
The traders that stick to a single timeframe are often frustrated on ranging days that they can't trade or because they are bored they take any old trade.
With the Broom-Hilda system there is always a trade. You may think that with Broom-Hilda being trend following that it isn't possible to always have a trade. The thing is that most traders are not happy to change timeframes to find that trend.
If there isn't a trend on the 5 min they just sit there ****struck waiting and waiting. Letting pips come and go. When the trend does appear on the 5 min they had no idea it was coming and as such miss out on the best of it.
Broom-Hilda will tell you when a move is imminent Broom-Hilda will tell you exactly where to trade and where not to. Stick to the trading titles and you will make good pips out of any currency market.
There are TWO ways of playing Broom-Hilda. The first is in general trading and the second is with picking reversal points. Yes, I'll say that again - Broom-Hilda will find medium term tops and bottoms. Not every time, but when a signal shows as described in a while it is 80% accurate at picking the top and bottom.
General Trading system
Ok, here is how we play Broom-Hilda - regardless of the timeframe these rules are across the board.
Take a look at the screenshot below, this was the current chart as someone else wrote this. It may help if you zoom in but it may not as the quality is pretty **** but you'll get the idea anyway as we go along.
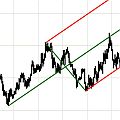
This chart should match yours in its layout- if not then arrange it this way yourself - the order is important psychologically as they are in the order of importance. Please ignore the lines you see on some of these charts - the author is a real *****.
This layout shows the 5 and the 15 min - my usual trading setup
Just in case your chart fails or the template doesn't work here is the setup we use
• 200 simple moving average in white
• 100 weighted moving average in red
• 34 weighted moving average in yellow
• SuperWoodiesCCI set at 50 and 0
• ColorOsMA set at 8,12,9
• Broom-Hilda indicator at default settings (J_TPO of 10 in case you didn't read that before)
Finding a trend
The first thing we do is identify a trend and also where there is no trend.
What you are looking for is a timeframe where Woodies CCI has a definite colour for a good amount of time. I'd like to make this really simple and say 'you must have at least 6 bars green or six bars red' but in reality sometimes its less than that and sometimes its more - This will come to you after a short period of time so don't worry - after a few days you will just 'know'.
There is a 'No Trade' rule.
Look at the chart above and note in particular the 5 minute chart on the left.
Note how the moving averages are intertwined with each other - like a DNA spiral. I call this effect 'cabling' because it looks like telephone cable all intertwined. It's very important that when you have cabling you totally ignore that timeframe which it is on.
The cabling shows that the market is undecided and in a rut.
That doesn't mean we don't stop trading. When cabling is present there are two things you can do. You either go up in timeframes or you go down.
Hopefully someone will cover this part of the system in more detail in a future Paltalk session but let me show you exactly what I mean - as you can see in the chart above it's a 'no trade signal' on the 5 and 15 - so we move up - I looked at the 30 min, that wasn't clever and so the 1 hour- a trend is showing so I'm going to pair the one hour chart with a 15 min chart like this. 15 on the left and one hour on the right.
As you can see there IS a trend - it's just that it's on the one hour.
So whilst the lower timeframes are poor, the longer term one is clear as day - the trend is still down.
What we are now looking for is for a short whilst everyone else is say scratching their heads you start a trade. Lets show you how and then you can come back to this and look again.
It's important to say that in this example you would take some profit where possible and get some pips locked in as soon as you are say 15 pips up. Why? Because the 1 hour Broom-Hilda isn't following your shorter timeframe is why. When they all line up together in the same direction - that's when you get the 100+ pip trades.
A conservative player will always wait for both the long term and shorter term charts to be in prime position before placing the trades - that will gain the highest percentage of wins to losses.
Anyway, I'm running (and trying to impress you on a system that I could have charged you an obscene amount of cash for) before you can walk - let's slow down here.
For now, let's imagine that the chart below represents today.
As you can see the 15 minute chart shows a good trend on the SuperWoodiesCCI indicator - it's all red. The five min chart on the left has also shown a good red downtrend.
I'm guessing by now just a simple look at the charts will explode the Broom-Hilda method into your mind. (Imagine the exploding minds of people who bought this type of system from others on the internet - wow)
I'm going to introduce you to some really ****** sounding terms:
'Broom-Hilda flying her kite' and 'Broom-Hilda is fishing'.
If I say that 'Broom-Hilda is flying her kite' then the Broom-Hilda indicator is above the 0.85 line on the chart. It looks like she has a piece of string flying up in the air.
If I say 'Broom-Hilda is fishing' then the Broom-Hilda indicator is below 0.85 and resembles a fishing line in the water. You get the idea? I'm trying really really professional but relaxed here.
Right then - here is the perfect trade setup. As you can see above I have marked 2 red lines on the charts - the time on both at that point is 11:30am Metatrader time (GMT)
At that point on the 15 min the CCI was red. Broom-Hilda was flying a kite and the OsMA was high.
On the five minute Broom-Hilda was high and OsMA was still blue.
We now have a trade setup.
We are waiting for one of two things to happen - either one will initiate a short trade:
1) on the 15 min chart the OsMA makes a lower bar AT THE CLOSE OF THAT BAR
Or
2) the 5 minute OsMA turns red at the close of the 5 min bar
Either of these would initiate a sell signal and in actual fact we sold at 1.7422 - you'll see that trade in our diary blog of the 19th July 2005.
If you look carefully at the 15 min chart you will see that there was an earlier entry into this trade also at 5:30 GMT – unfortunately, I was sleeping at that time but that would have got you in at 1.7480 from whence the price dropped almost 100 pips.
It's always a confirmed when the price is touching one of the moving averages at the same time as Broom-Hilda is in a buy / sell position also - you see how price bounced along the 34 wma whilst the setup was building and finally came off the 100 WMA?
Don't wait for the 100 though - it bounces off the 34 just as well.
Believe it or not, there isn't much more to Broom-Hilda than that and that's how to trade it day in and day out. Let's show you a long trade now:
This chart is of the 12th July 2005 GBPUSD.
Is that entry obvious or what? - Unfortunately that entry was at 1am in the morning for me!! - however the subsequent Broom-Hilda dip at 8:15am gave me entries back into this trend by seeing the dip in the 15 min and a fishing Broom-Hilda on the 5 min whilst at the same time bouncing off the 34wma on the 15 - you see that?
You can also see that the bar I've marked on the 5 minute WAS the one with a higher OsMA close - and it was the exact bottom! Am I sounding impressive now - imagine getting all this for zero dollars down and nothing to pay whatsoever.
There are a few more little things to take you through on this like divergence spotting etc - but they aren't really needed - they just add to your perception of trade risk.
Stop Losses
Ask me in training about the use of intelligent stop placement - that's what you will use. However as a general rule on 5 and 15 min chart use 10+spread. One minute charts 6+spread and above this, it has to be all intelligent stops - somone will explain this to you in live training.
Exits
Exits are a very personal tiling — some people will be happy to take 20 pips on every trade whilst others (like me) will let it run and run until the trend is exhausted.
Broom-Hilda makes it easy though to find your exits.
There's a rule and this is hard and fast
Whichever chart gave you the strongest entry signal is the chart you will use to exit.
Let me explain this a little clearer.
A 15 min is stronger than a 5 min signal, a 5 min is stronger than a 1 min signal and a one hour is stronger than a 15 min etc etc.
So if you went short on a Broom-Hilda and OsMA top on the 15 min using the 5 min as confirming then you exit on the strongest one - the 15 min.
There are several ways of exiting
1) Exit when a bar closes and gives a higher / lower OsMA than the previous one - i.e. - if you are short and a bar closes with the OsMA higher than the last bar then you close - remember you can always re-enter
2) Trail the peaks. - This is the method I use and on the shorter timeframe chart I will trail the peaks with a stop. As the longer timeframe drops or rises the shorter timeframe Broom-Hilda will rise and fall several times whilst the longer timeframe just carries on. If the stop is hit then I'm out - if it isn't I STILL EXIT WITH THE OSMA AS ON EXIT 1 above
3) Set a profit target - not the best method because I've never been into limiting profits - but we are all different and many are successful with this method.
So, lets just review this first way of trading Broom-Hilda.
1. Look at all time-frames
2. Observe Super-Woodie's (Setting 50/0). We are looking for the trend, particularly on the longer time-frames. Is it predominantly Red or Green (at least six bars), this is the trend on any time-frame we are looking at. So if S/W is showing Green we are only looking for long trades, if red only shorts. (Note: That if blue is showing that is taken as the previous colour, say Red. Until a Green bar appears, trend on that time-frame is still considered to be down.)
3. Look at the Moving Averages (34WMA, 100WMA & 200SMA). Is there decent separation. If they are 'cabling', in other words do they seem to be tangled together - this means no trade as price can't make its mind up on this timeframe. This is where all the muppet traders lose their money in the whipsaws
4. It is most important to remember that trades are almost always better if you are taking trades on the 'right side' of the MA's. That is if you are 'buying' you are better placed above the 34WMA and either above the 200SMA (best), or at least have decent enough 'room', at least 30 - 50 pips between Price and the 200 SMA.
5. The Heart of the system is the Broom-Hilda indicator. When the Broom-Hilda, is 'Flying a Kite' i.e. at or above the 0.85 line, we wait for the line to start coming down and providing we are trading in the direction of the trend on that time-frame, in this instance the Super-Woodie's will be red AND the OsMA is lower on the close of the bar than the previous one, we will take the trade for a short. It is important to remember that we must wait for the close of the OsMA and when we take that trade we will also exit using the same timeframe. For a buy the opposite of the above is to be seen. The Broom-Hilda line will be 'Fishing' i.e. on or below the -0.85 line. The Super-Woodie's will be Green and the OSMA bar (don't forget to wait for the close of the bar!) will be higher than the previous OsMA bar.
6. The ColorOsMA. This is the final one of the three indicators used in the Broom-Hilda system. The main use of OsMA is the trade entry trigger. As described above, we take trades depending on whether they are higher or lower than preceding bars. Another great use of the OsMA is for divergence. This may be particularly useful on the lower time-frames.
7. It is always best to place stops in an intelligent area, for example, just above or below strong resistance or support or even previous highs or lows. But as a general rule of thumb, on the lower time frames such as 1 & 5 Minutes, the stop would be around the 10 pips area and on the higher 30 Minutes and 1 Hour TFs it would be 20 ish. Perhaps the best time-frame to trade Broom-Hilda is the 15 Minutes and the stop could be 15/20 - more about this in training.
Points to Remember
A. Always give preference to what is happening on the higher time-frames.
B. Don't take a trade out of 'sync'. That is, if you see a Broom-Hilda trade on the 5 minutes, and the 15 Minute Chart (and perhaps the others too) are telling you something different. Say the 15 looks like it is going to set-up for a buy. Don't take a sell on the 5 Minute. You always have to bear in mind the other time-frames.
C. If you can couple entry with a bounce off a Moving Average then you can't go far wrong.
D. You are always looking for a re-entry into a trend (Except when playing the Broom-Hilda reversal signal trade - described later).
At this point you should look at the charts of all currencies and look back - spend as long as you want studying the charts and write down your questions. The look back procecss might encounter a problem with the Broom-Hilda running out of signal. If this is the case, increase it's lookback 'viewbars' setting under the indicator's properties. In the long run, you'll appreciate a low setting in it's day-to-day running so it's responsive and not a memory hungry slug like other commercial systems of the same nature.
Here's one of the most exciting aspects of the Broom-Hilda system.
The Broom-Hilda Reversal Signal.
This will make you cringe with delight when you see it work.
I discovered this totally by accident when looking back on the charts and the accuracy is amazing. The setup doesn't happen very often, but then neither do reversals on forex.
I have never believed that it was possible to pinpoint a reversal. There are so many variables to take into account.
Many people use divergence and they look first for single, then double right up to and including quadruple divergence. But never has reversal spotting been as simple as this.
It's important to note that this does not spot every reversal but when it does signal one it's usually good. Great thanks would have to go to the guys at Jurik for the TPO indicator that the Broom-Hilda indicator is a rip-off from. I don't blame you for not wanting to pay GBP2300.00 for a rip-off indicator
This is a 15 min chart of the 15th July 2005
You see where the red line is - do you notice anything about that?
Here's the setup:
Broom-Hilda is either fishing or kite flying at the same time OsMA changes colour.
That's it!
This only works effectively on timeframes of 15 min and above and of course the larger the time frame the larger the move (and stop).
Look at the chart above - price had been steady going up when at 10:15 Broom-Hilda was kite flying and OsMA went red - trade the reversal.
Here's another one:
Doesn't look much but that was 100 pips And another - this time on a one hour chart
Price went 300 pips on that last one.
As you see there is more than enough trades on Broom-Hilda to keep you busy, all of the trades I've shown you here have been in either the last few days or the last two weeks.
Scalping
There are some times in the market when there just isn't a trend that's good for you - that's when you scalp Broom-Hilda on a one min chart.
Exactly the same as before apart from you're only using one chart. And this time you note the moving averages
If the 34 is above the 100 then you look for longs and vice versa for shorts - here is today's chart since 11am (its now 2pm) and each red line shows a trade scalp - note that you can take trades that don't quite make the fishing and kite lines on a scalp.
Finale!
Well, that's it - that's Broom-Hilda.
This system supposedly took 6 full months of someone else's life to put together and get working. I've tried very hard to make the system as free as possible but if you have any suggestions as to where I can improve the system or methods of delivery I would love to hear from you. Who's going to organise and get a chat channel going for all the other freeloaders ?
It would also be good if you could drop me a testimonial about the system so that I could use it to share with others.
Thank you for leeching this - kinda makes it worthwhile
I really wish you well in your trading career
Hilda Baker
Wskaźniki i template do MT4.
Uwaga, w tym zipie są dwa identyczne wskaźniki a konkretnie JTPO. Z tym, że oryginalny działa bardzo wolno i spowalnia mt4. Jak widać jest tam plik jtpofast i właśnie ten wskaźnik działa sprawnie dlatego zalecam podmiane.
Jak już podmienicie te pliki to zmieńcie ustawienie wskaźnika jtpofast na 10! podobno to bardzo ważne.
W każdym razie na wszelki wypadek sprawdźcie sobie ustawienia wskaźników, które powinny wyglądać tak:
• 200 simple moving average in white
• 100 weighted moving average in red
• 34 weighted moving average in yellow
• SuperWoodiesCCI set at 50 and 0
• ColorOsMA set at 8,12,9
• J_TPO set at 10
Nie masz wymaganych uprawnień, aby zobaczyć pliki załączone do tego posta.

U mnie tak to wygląda. Wystarczy rozparować plik "systemhilda", wkleić pliki ColorOsMa, JTPOFast i SuperWoodieCCI do katalogu indicators a plik hilda.tpl do katalogu templates w programie np. Metatrader firmy Northfinance czy X-Trade. Nastepnie kliknąć prawym przyciskiem myszy na wykres ceny, wybrać pozycję "szablon" a na końcu hilda. JTPOFast uruchomił się po kliknięciu na: wstaw, wskaźniki, własne, JTPOFast
Nie masz wymaganych uprawnień, aby zobaczyć pliki załączone do tego posta.