Wrzuce jeszcze przykład jak zrobić wykres zysków i strat. Może komuś się przyda. Jest kilka zmian w kodzie strategii którą wrzuciłem wyżej, pobrane są jeszcze informacje P/L, kierunek, instrument
Kod: Zaznacz cały
package jforex;

import com.dukascopy.api.*;
import java.io.*;
import java.util.*;
import com.dukascopy.api.IEngine.OrderCommand;

import javax.swing.filechooser.*;

public class TestBarsSaving implements IStrategy {
   private IContext context;
   private IConsole console;
   private IHistory history;
   private IEngine engine;
   private IOrder order;

   public void onStart(IContext context) throws JFException {
      this.context = context;
      console = context.getConsole();
      history = context.getHistory();
      engine = context.getEngine();

      //order = engine.submitOrder("MyMaketBuyOrder1", Instrument.EURUSD, OrderCommand.BUY, 0.005);
      //order = engine.submitOrder("MyMaketBuyOrder2", Instrument.EURUSD, OrderCommand.SELL, 0.001);
      //order = engine.submitOrder("MyMaketBuyOrder3", Instrument.EURUSD, OrderCommand.BUY, 0.002);
   }

   public void onAccount(IAccount account) throws JFException {}

   public void onMessage(IMessage message) throws JFException {}

   public void onStop() throws JFException {}

   public void onTick(Instrument instrument, ITick tick) throws JFException {

      // test
      //order.close();

      long prevBarTime = history.getPreviousBarStart(Period.TEN_SECS, tick.getTime());
      //List<IBar> bars = history.getBars(instrument, Period.TEN_SECS, OfferSide.BID, prevBarTime - 1000L * 10L * 9L, prevBarTime);
      List<IBar> bars = history.getBars(instrument, Period.TEN_SECS, OfferSide.BID, prevBarTime - 1000L * 10L * 9, prevBarTime);
      File dirFile = new File(getMyStrategiesDir(), "files");
      if (!dirFile.exists()) {
         console.getErr().println("Please create files directory in My Strategies");
         context.stop();
      }
      File file = new File(dirFile, "test.js");
      console.getOut().println("Writing file " + file);

      // history orders
      long time = System.currentTimeMillis();
      IBar bar10 = history.getBar(Instrument.EURUSD, Period.ONE_HOUR, OfferSide.BID, 100);
      IBar bar1 = history.getBar(Instrument.EURUSD, Period.ONE_HOUR, OfferSide.BID, 0);
      List<IOrder> previousOrders =  history.getOrdersHistory(Instrument.EURUSD, time - Period.MONTHLY.getInterval(), time);

      //console.getOut().println( previousOrders );

      try {
         PrintWriter pw = new PrintWriter(file);
         //for (IBar bar : bars) {
            //pw.println("[" + bar.getTime() + "," + bar.getOpen() + "," + bar.getClose() + "," + bar.getHigh() + "," + bar.getLow() + "," + bar.getVolume() + "]");
         //}
         pw.println("var arr=[");
         for (IOrder order : previousOrders) {
             pw.println( "{" +
                 "instrument:" + '"' + order.getInstrument() + '"' + "," +
                 "id:" + order.getId() + "," +
                 "cmd:" + '"' + order.getOrderCommand() + '"' + "," +
                 "amount:" + order.getAmount() + "," +
                 "PLaccCurrency:" + order.getProfitLossInAccountCurrency() +
                 "}," );
         }
         pw.println("];");
         pw.close();

      } catch (IOException e) {
         e.printStackTrace(console.getErr());
      }
      console.getOut().println("File saved, exiting");
      context.stop();
   }

   public void onBar(Instrument instrument, Period period, IBar askBar, IBar bidBar) throws JFException {}

   public static File getMyStrategiesDir() {
      File myDocs = FileSystemView.getFileSystemView().getDefaultDirectory();
      File dir = new File(myDocs.getPath() + File.separator + "My Strategies");
      return dir;
   }
}
Plik html, tak samo kilka zmian w stosunku do tego co jest post wyżej
Kod: Zaznacz cały
<html>
  <head>
    <style>
      #myChart {
        width: 100%;
        height: 100%;
      }
      #canvasId1 {
        width: 800px;
        height: 350px;
      }
    </style>
  </head>
  <body>

    <div id="canvasId1">
      <canvas id="myChart"></canvas>
    </div>

    <script src="files/require.js"></script>
    <script src="files/test.js"></script>


    <script>
    var ctx = document.getElementById("myChart");

    function itemsID() {
      var it = [];
      for ( var i = 0; i < arr.length; i ++ ) {
        it.push( i );
      }
      return it;
    }

    console.log( itemsID() );

    function getID() {
      var ar = [];
      for ( var i = 0; i < arr.length; i ++ ) {
       ar.push( arr[ i ].id );
      }
      return ar;
    }

    function getAmount() {
      var am = [];
      for ( var i = 0; i < arr.length; i ++ ) {
       am.push( arr[ i ].PLaccCurrency );
      }
      return am;
    }

    function makeBorder() {
      var bor = [];
      for ( var i = 0; i < arr.length; i ++ ) {
       bor.push( 'rgba(0,0,0,1)' );
      }
      return bor;
    }

    function borderColor() {
      var borc = [];
      var a = 0;
      var b = 0;
      var c = 0;
      for ( var i = 0; i < arr.length; i ++ ) {
        a = Math.floor(Math.random() * 255);
        b = Math.floor(Math.random() * 255);
        c = Math.floor(Math.random() * 255);
        borc.push( 'rgba(' + a + ',' + b + ',' +  c + ',' + 0.2 + ')' );
      }
      return borc;
    }

    require(['files/Chart.js'], function(Chart){
        var myChart = new Chart(ctx, {
        type: 'bar',
        data: {
            labels: itemsID(),
            datasets: [{
                label: 'Profit & Loss EUR/USD',
                data: getAmount(),
                backgroundColor: borderColor(),
                borderColor: makeBorder(),
                borderWidth: 0.5
            }]
        },
        options: {
            scales: {
                yAxes: [{
                    ticks: {
                        beginAtZero:true
                    }
                }]
            }
        }
    });
    });

    </script>

  </body>
</html>
Wygenerowany plik test.js ze zrzutem pozycji
Kod: Zaznacz cały
var arr=[
{instrument:"EUR/USD",id:97249371,cmd:"SELL",amount:0.001,PLaccCurrency:1.06},
{instrument:"EUR/USD",id:97402915,cmd:"BUY",amount:0.01,PLaccCurrency:-212.07},
{instrument:"EUR/USD",id:97425779,cmd:"BUY",amount:0.01,PLaccCurrency:-145.71},
{instrument:"EUR/USD",id:97426810,cmd:"BUY",amount:0.01,PLaccCurrency:13.68},
{instrument:"EUR/USD",id:97429654,cmd:"BUY",amount:0.01,PLaccCurrency:-83.8},
{instrument:"EUR/USD",id:97431151,cmd:"BUY",amount:0.01,PLaccCurrency:-29.07},
{instrument:"EUR/USD",id:97527101,cmd:"SELL",amount:0.003327,PLaccCurrency:13.88},
{instrument:"EUR/USD",id:97529327,cmd:"SELL",amount:0.002594,PLaccCurrency:3.9},
{instrument:"EUR/USD",id:97518833,cmd:"SELL",amount:0.005,PLaccCurrency:10.95},
{instrument:"EUR/USD",id:97519679,cmd:"SELL",amount:0.005,PLaccCurrency:8.04},
{instrument:"EUR/USD",id:97519711,cmd:"SELL",amount:0.003917,PLaccCurrency:6.03},
{instrument:"EUR/USD",id:97539156,cmd:"SELL",amount:0.005,PLaccCurrency:4.28},
{instrument:"EUR/USD",id:97559814,cmd:"SELL",amount:0.005,PLaccCurrency:-105.52},
{instrument:"EUR/USD",id:97554326,cmd:"SELL",amount:0.0025,PLaccCurrency:-59.34},
{instrument:"EUR/USD",id:97555220,cmd:"SELL",amount:0.001,PLaccCurrency:-23.84},
{instrument:"EUR/USD",id:97609681,cmd:"SELL",amount:0.00284,PLaccCurrency:8.26},
{instrument:"EUR/USD",id:97609755,cmd:"SELL",amount:0.001,PLaccCurrency:2.46},
{instrument:"EUR/USD",id:97612284,cmd:"SELL",amount:0.002234,PLaccCurrency:11.31},
{instrument:"EUR/USD",id:97609862,cmd:"SELL",amount:0.002,PLaccCurrency:16.49},
{instrument:"EUR/USD",id:97613300,cmd:"SELL",amount:0.00181,PLaccCurrency:5.76},
{instrument:"EUR/USD",id:97679753,cmd:"SELL",amount:0.004197,PLaccCurrency:0.86},
{instrument:"EUR/USD",id:97676366,cmd:"SELL",amount:0.004181,PLaccCurrency:2.0},
{instrument:"EUR/USD",id:97688981,cmd:"SELL",amount:0.001,PLaccCurrency:2.53},
{instrument:"EUR/USD",id:97689598,cmd:"SELL",amount:0.00172,PLaccCurrency:8.18},
{instrument:"EUR/USD",id:97694258,cmd:"SELL",amount:0.001743,PLaccCurrency:3.16},
{instrument:"EUR/USD",id:97695469,cmd:"SELL",amount:0.001774,PLaccCurrency:-1.52},
{instrument:"EUR/USD",id:97695601,cmd:"SELL",amount:0.003541,PLaccCurrency:-2.3},
{instrument:"EUR/USD",id:97695968,cmd:"SELL",amount:0.003446,PLaccCurrency:2.95},
{instrument:"EUR/USD",id:97696207,cmd:"SELL",amount:0.004072,PLaccCurrency:11.28},
{instrument:"EUR/USD",id:97696543,cmd:"SELL",amount:0.0021,PLaccCurrency:9.05},
{instrument:"EUR/USD",id:97735198,cmd:"BUY",amount:0.003628,PLaccCurrency:7.07},
{instrument:"EUR/USD",id:97743251,cmd:"BUY",amount:0.005922,PLaccCurrency:20.46},
{instrument:"EUR/USD",id:97748331,cmd:"BUY",amount:0.006055,PLaccCurrency:12.43},
{instrument:"EUR/USD",id:97746972,cmd:"BUY",amount:0.003943,PLaccCurrency:-3.37},
{instrument:"EUR/USD",id:97747121,cmd:"BUY",amount:0.001,PLaccCurrency:1.33},
{instrument:"EUR/USD",id:97747170,cmd:"BUY",amount:0.001,PLaccCurrency:0.89},
{instrument:"EUR/USD",id:97751152,cmd:"BUY",amount:0.002,PLaccCurrency:-4.24},
{instrument:"EUR/USD",id:97768907,cmd:"BUY",amount:0.0025,PLaccCurrency:3.93},
{instrument:"EUR/USD",id:97769494,cmd:"SELL",amount:0.005,PLaccCurrency:10.43},
{instrument:"EUR/USD",id:97769718,cmd:"BUY",amount:0.0025,PLaccCurrency:2.99},
{instrument:"EUR/USD",id:97975468,cmd:"BUY",amount:0.005,PLaccCurrency:2.74},
{instrument:"EUR/USD",id:97975469,cmd:"SELL",amount:0.001,PLaccCurrency:-0.75},
{instrument:"EUR/USD",id:97975470,cmd:"BUY",amount:0.002,PLaccCurrency:1.09},
];
Wykres zysków i strat
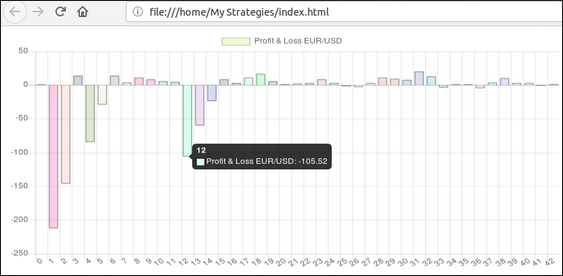
Tutaj już więcej nie będę śmiecił. Sam dla siebie i tak będę coś takiego robił ale nie teraz, na razie zostawiam to tutaj bo może ktoś z tego będzie potrafił skorzystać. btw. to były moje ostatnie trejdy na EURUSD konto live heh
-- Dodano: 28 lut 2018, 13:58 --
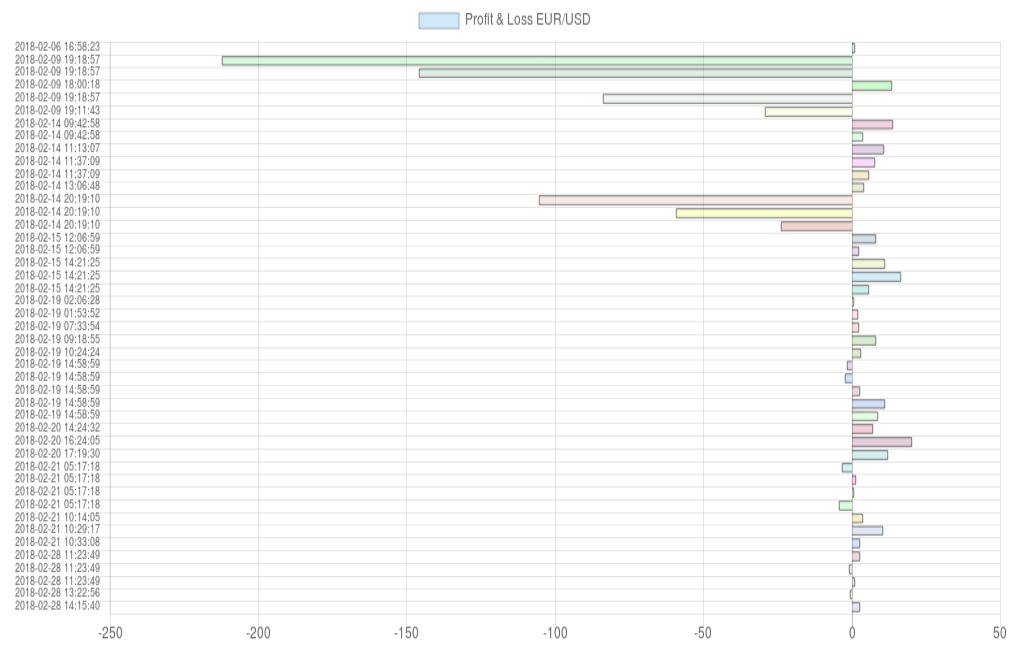
Dobra, jeszcze tylko to. Wersja wykresu horyzontalnego z datą transakcji, te same transakcje tylko dodany czas zamkniecia pozycji oraz zmieniony kod w pliku html.
Kod: Zaznacz cały
package jforex;

import com.dukascopy.api.*;
import java.io.*;
import java.util.*;
import com.dukascopy.api.IEngine.OrderCommand;

import javax.swing.filechooser.*;

import java.text.SimpleDateFormat;
import java.util.TimeZone;

public class TestBarsSaving implements IStrategy {
   private IContext context;
   private IConsole console;
   private IHistory history;
   private IEngine engine;
   private IOrder order;

   private SimpleDateFormat sdf;

   public void onStart(IContext context) throws JFException {
      this.context = context;
      console = context.getConsole();
      history = context.getHistory();
      engine = context.getEngine();

      Date date = new Date();
      sdf = new SimpleDateFormat("yyyy-MM-dd HH:mm:ss");

      //print( sdf.format(date) );

      //order = engine.submitOrder("MyMaketBuyOrder1", Instrument.EURUSD, OrderCommand.BUY, 0.005);
      //order = engine.submitOrder("MyMaketBuyOrder2", Instrument.EURUSD, OrderCommand.SELL, 0.001);
      //order = engine.submitOrder("MyMaketBuyOrder3", Instrument.EURUSD, OrderCommand.BUY, 0.002);
   }

   public void onAccount(IAccount account) throws JFException {}

   public void onMessage(IMessage message) throws JFException {}

   public void onStop() throws JFException {}

   public void onTick(Instrument instrument, ITick tick) throws JFException {

      // test
      //order.close();

      long prevBarTime = history.getPreviousBarStart(Period.TEN_SECS, tick.getTime());
      //List<IBar> bars = history.getBars(instrument, Period.TEN_SECS, OfferSide.BID, prevBarTime - 1000L * 10L * 9L, prevBarTime);
      List<IBar> bars = history.getBars(instrument, Period.TEN_SECS, OfferSide.BID, prevBarTime - 1000L * 10L * 9, prevBarTime);
      File dirFile = new File(getMyStrategiesDir(), "files");
      if (!dirFile.exists()) {
         console.getErr().println("Please create files directory in My Strategies");
         context.stop();
      }
      File file = new File(dirFile, "test.js");
      console.getOut().println("Writing file " + file);

      // history orders
      long time = System.currentTimeMillis();
      IBar bar10 = history.getBar(Instrument.EURUSD, Period.ONE_HOUR, OfferSide.BID, 100);
      IBar bar1 = history.getBar(Instrument.EURUSD, Period.ONE_HOUR, OfferSide.BID, 0);
      List<IOrder> previousOrders =  history.getOrdersHistory(Instrument.EURUSD, time - Period.MONTHLY.getInterval(), time);

      //console.getOut().println( previousOrders );

      try {
         PrintWriter pw = new PrintWriter(file);
         //for (IBar bar : bars) {
            //pw.println("[" + bar.getTime() + "," + bar.getOpen() + "," + bar.getClose() + "," + bar.getHigh() + "," + bar.getLow() + "," + bar.getVolume() + "]");
         //}
         pw.println("var arr=[");
         for (IOrder order : previousOrders) {
             pw.println( "{" +
                 "instrument:" + '"' + order.getInstrument() + '"' + "," +
                 "id:" + order.getId() + "," +
                 "cmd:" + '"' + order.getOrderCommand() + '"' + "," +
                 "amount:" + order.getAmount() + "," +
                 "PLaccCurrency:" + order.getProfitLossInAccountCurrency() + "," +
                 "dateClose:" + '"' +  sdf.format(order.getCloseTime()) + '"' +
                 "}," );
         }
         pw.println("];");
         pw.close();

      } catch (IOException e) {
         e.printStackTrace(console.getErr());
      }
      console.getOut().println("File saved, exiting");
      context.stop();
   }

   public void onBar(Instrument instrument, Period period, IBar askBar, IBar bidBar) throws JFException {}

   public static File getMyStrategiesDir() {
      File myDocs = FileSystemView.getFileSystemView().getDefaultDirectory();
      File dir = new File(myDocs.getPath() + File.separator + "My Strategies");
      return dir;
   }

   public void print( Object obj ) {
       console.getOut().println( obj );
   }
}
kod html, wersja horyzontalna wykresu słupkowego
Kod: Zaznacz cały
<html>
  <head>
    <style>
      #myChart {
        width: 100%;
        height: 100%;
      }
      #canvasId1 {
        width: 1000px;
        height: 650px;
      }
    </style>
  </head>
  <body>

    <div id="canvasId1">
      <canvas id="myChart"></canvas>
    </div>

    <script src="files/require.js"></script>
    <script src="files/test.js"></script>


    <script>
    var ctx = document.getElementById("myChart");

    function itemsID() {
      var it = [];
      for ( var i = 0; i < arr.length; i ++ ) {
        it.push( i  );
      }
      return it;
    }

    function dateclose() {
      var ity = [];
      for ( var i = 0; i < arr.length; i ++ ) {
        var txt = arr[ i ].dateClose;
        //txt = txt.substring(0,10);
        ity.push( txt );
      }
      return ity;
    }

    console.log( dateclose() );

    function getID() {
      var ar = [];
      for ( var i = 0; i < arr.length; i ++ ) {
       ar.push( arr[ i ].id );
      }
      return ar;
    }

    function getAmount() {
      var am = [];
      for ( var i = 0; i < arr.length; i ++ ) {
       am.push( arr[ i ].PLaccCurrency );
      }
      return am;
    }

    function makeBorder() {
      var bor = [];
      for ( var i = 0; i < arr.length; i ++ ) {
       bor.push( 'rgba(0,0,0,1)' );
      }
      return bor;
    }

    function borderColor() {
      var borc = [];
      var a = 0;
      var b = 0;
      var c = 0;
      for ( var i = 0; i < arr.length; i ++ ) {
        a = Math.floor(Math.random() * 255);
        b = Math.floor(Math.random() * 255);
        c = Math.floor(Math.random() * 255);
        borc.push( 'rgba(' + a + ',' + b + ',' +  c + ',' + 0.2 + ')' );
      }
      return borc;
    }

    require(['files/Chart.js'], function(Chart){
        var myChart = new Chart(ctx, {
        type: 'horizontalBar',
        data: {
            labels: dateclose(),
            datasets: [{
                label: 'Profit & Loss EUR/USD',
                data: getAmount(),
                backgroundColor: borderColor(),
                borderColor: makeBorder(),
                borderWidth: 0.5
            }]
        },
        options: {
            scales: {
                yAxes: [{
                    ticks: {
                        beginAtZero:true,
                        fontSize: 9
                    }
                }],
                xAxes: [{
                    ticks: {
                        fontSize: 12,
                        maxRotation: 90
                    }
                }]
            }
        }
    });
    });

    </script>

  </body>
</html>
Efekt, obrazek jest za duży żeby umieszczać go bezpośrednio w poście, dlatego wstawiam link do obrazka
https://images82.fotosik.pl/1007/a1ffde53a18b0f23.png
Myśle że troche nakierowałem kogoś kto się tym zainteresuje...


